Muscatine

obumbler Redistributing the Poverty

Posted in: Muscatine
  • Avatar
  • hiroad
  • Respected Neighbor
  • The Hilltop
  • 5055 Posts
  • Respect-O-Meter: Respected Neighbor

Food Stamps Charts

These charts show the number of Americans receiving food stamps as reported by the United States Department of Agriculture. As of the latest data released on September 6, 2013, the total is 47.76 million, which is more than the entire populations of many large nations.

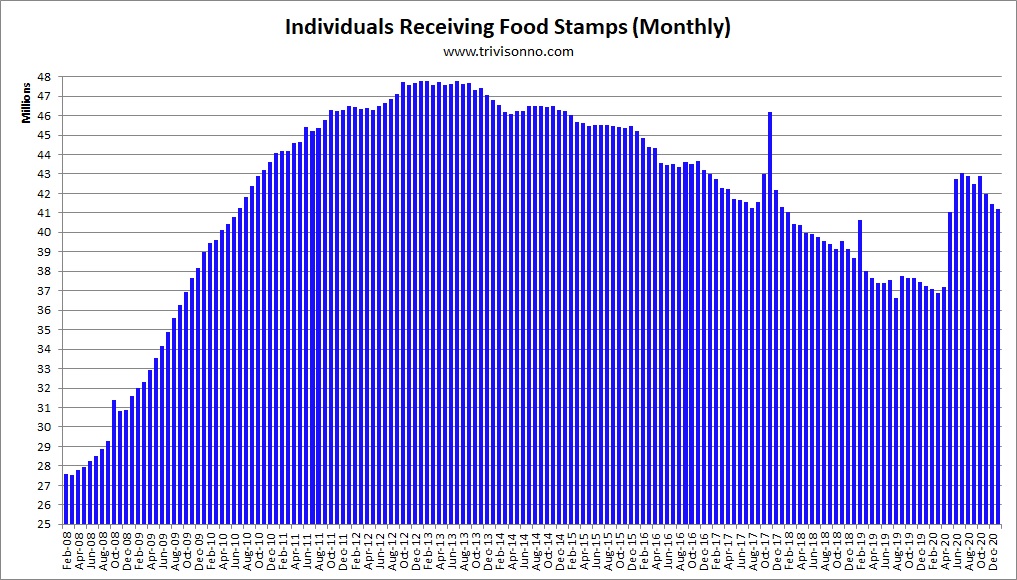
The first chart shows monthly totals over the last several years (click charts to enlarge):

Food-Stamps-Monthly

The second chart shows annual totals back to 1975:

Food-Stamps-Yearly

Since the year 2000, the annual total has only declined once, in 2007. (Note: The chart above is the average size of the food-stamp population over the year.)

The next chart shows the number of people added to the food-stamps program each month:

Food-Stamps-Added

The jump in September 2012 was due to Hurricane Isaac.

The spike in May 2011 was due to a surge in Alabama after an historic onslaught of giant tornadoes devastated the state. According to the USDA’s report, about 1 million disaster victims from several states were added to the rolls.

The next chart compares our food-stamp population to the total populations of selected nations:

Food-Stamps-Nations

The next chart shows the percentage of Americans on food stamps (using FRED’s “POP” data series):

Food-Stamps-Percent

The next chart shows the monthly amount paid to recipients. Starting from $6.63 in 1969, the amount has risen steadily, primarily due to inflation. However, the amount dropped by 44 cents in 2012:

Food-Stamps-Monthly-Benefit

The next chart shows the total annual benefits paid out. At $74.6 billion in fiscal 2012, this is a major program:

Food-Stamps-Annual-Benefits

A program with this many participants incurs huge administrative costs: $3.8 billion in 2012 – and that is only the federal government’s share. In addition, each state spends money to administer their end of the operation. The chart shows only federal expenses. Costs declined by $103 million in 2012:

Food-Stamps-Administration-Costs

The next chart shows the breakdown of participants by race (see table A.21 of this USDA report):

Food-Stamps-Race

The next chart shows the number of individuals added to, or subtracted from, the food stamp rolls highlighted by presidential administration:

Food-Stamps-Presidents

The next chart shows the numerical totals for each president. Keep in mind that not all presidents were in office for the same number of years:

Food-Stamps-Presidents-Totals

Read more:

Notes
Note: The numbers for Presidents Bush (43) and Obama are higher than they otherwise would have been because the government started to use food stamps for disaster relief starting in 2005 for Hurricane Katrina. See this PDF document for those numbers.

Note: The annual totals used above are based on the federal government’s fiscal year, which begins in October.

Note: States are allowed to deny food stamps to convicted felons. Different states have different policies, however it doesn’t effect their expenditures either way since the USDA pays for all food stamps.

Note: The USDA reports monthly food-stamp data with a two-month delay.

Note: The March 2012 numbers are slightly elevated due to disaster relief for windstorms that occurred in February and March 2012. However, the USDA did not give exact numbers, possibly because “congregate feeding” methods were used. See their statement here.

Note: The Obama Administration loosened the ABAWD (able-bodied adults without dependents) requirements. So, that accounts for a small portion of the increase in food-stamp usage. This action was similar to extending unemployment benefits due to the poor job market. See this report from the Congressional Research Service for more information.

Note: See this page for the history of the food-stamp/SNAP program.

Note to bloggers: You may use any of the charts on this page on your blog as long as you include a link to this page. No hot-linking please.


The USDA releases updated food-stamp data each month.

Last update: September 6, 2013
Next update: October 4, 2013

  • Avatar
  • mutmeh
  • Respected Neighbor
  • 293 Posts
  • Respect-O-Meter: Respected Neighbor

Damn, I want food stamps now.

  • Avatar
  • hiroad
  • Respected Neighbor
  • The Hilltop
  • 5055 Posts
  • Respect-O-Meter: Respected Neighbor

Another "plausible" lie from the obumbler,  From about 9 months ago:


Thomas Sowell: You think ‘the rich’ cost government? Dec. 11, 2012 @ 09:13 PM


 One of the big advantages that President Obama has, as he plays “chicken” with the Congressional Republicans along the “fiscal cliff,” is that Obama is a master of the plausible lie, which will never be exposed by the mainstream media — nor, apparently, by the Republicans. A key lie that has been repeated over and over, largely unanswered, is that President Bush’s “tax cuts for the rich” cost the government so much lost tax revenue that this added to the budget deficit — so that the government cannot afford to allow the cost of letting the Bush tax rates continue for “the rich.” It sounds very plausible, and constant repetition without a challenge may well be enough to convince the voting public that, if the Republican-controlled House of Representatives does not go along with Obama’s demands for more spending and higher tax rates on the top 2 percent, it just shows that they care more for “the rich” than for the other 98 percent. What is remarkable is how easy it is to show how completely false Obama’s argument is. That also makes it completely inexplicable why the Republicans have not done so. The official statistics which show plainly how wrong Obama is can be found in his own “Economic Report of the President” for 2012, on page 411. You can look it up. You may be able to find a copy of the “Economic Report of the President” for 2012 at your local public library. Or you can buy a hard copy from the Government Printing Office or download an electronic version from the Internet. For those who find that “a picture is worth a thousand words,” they need only see the graphs published in the Nov. 30 issue of Investor’s Business Daily. What both the statistical tables in the “Economic Report of the President” and the graphs in Investor’s Business Daily show is that (1) tax revenues went up — not down — after tax rates were cut during the Bush administration, and (2) the budget deficit declined, year after year, after the cut in tax rates that have been blamed by Obama for increasing the deficit. Indeed, the New York Times reported in 2006: “An unexpectedly steep rise in tax revenues from corporations and the wealthy is driving down the projected budget deficit this year.” While the New York Times may not have expected this, there is nothing unprecedented about lower tax rates leading to higher tax revenues, despite automatic assumptions by many in the media and elsewhere that tax rates and tax revenues automatically move in the same direction. They do not. The Congressional Budget Office has been embarrassed repeatedly by making projections based on the assumption that tax revenues and tax rates move in the same direction. This has happened as recently as the George W. Bush administration and as far back as the Reagan administration. Moreover, tax revenues went up when tax rates went down, as far back as the Coolidge administration, before there was a Congressional Budget Office to make false predictions. The bottom line is that Barack Obama’s blaming increased budget deficits on the Bush tax cuts is demonstrably false. What caused the decreasing budget deficits after the Bush tax cuts to suddenly reverse and start increasing was the mortgage crisis. The deficit increased in 2008, followed by a huge increase in 2009. So it is sheer hogwash that “tax cuts for the rich” caused the government to lose tax revenues. The government gained tax revenues, not lost them. Moreover, “the rich” paid a larger amount of taxes, and a larger share of all taxes, after the tax rates were cut. That is because people change their economic behavior when tax rates are changed, contrary to what the Congressional Budget Office and others seem to assume, and this can stimulate the economy more than a government “stimulus” has done under either Bush or Obama. Yet there is no need to assume that Obama is mistaken about the way to get the economy out of the doldrums. His top priority has always been increasing the size and scope of government. If that means sacrificing the economy or the truth, that is no deterrent to Obama. That is why he is willing to play chicken with Republicans along the fiscal cliff.

Thomas Sowell, a native of North Carolina, is a senior fellow at the Hoover Institution, Stanford University, Stanford, CA 94305. His Web site is www.tsowell.com. Representations of fact and opinions are solely those of the author.

  • Stock
  • republican
  • Respected Neighbor
  • Muscatine, IA
  • 749 Posts
  • Respect-O-Meter: Respected Neighbor

Hey highroad, do you ever have an opinion of your own?

Advertise Here!

Promote Your Business or Product for $10/mo

istockphoto_1682638-attention.jpg

For just $10/mo you can promote your business or product directly to nearby residents. Buy 12 months and save 50%!

Buynow